
Network visualization is the practice of creating and displaying graphical representations of network devices, network metrics, and data flows. In plain speak, it’s the visual side of network monitoring and analysis. There are a variety of different subcategories of network visualization, including network maps, graphs, charts, and matrices. In the world of IT networks, network management software will usually have some type of network visualization features built in.
Benefits of network visualization
If you’ve ever been on a Zoom or Teams call and realized it’d just be easier to get your point across if you start sharing your screen, the benefits of network visualization should be easy to understand. Network visualization is our industry’s embodiment of the phrase “A picture is worth a thousand words.”
Network visualization allows administrators to quickly and intuitively understand a lot of information about the state of the network at a glance. For example, a network map can provide a network-wide topology overview that details physical and logical data flows. Charts and graphs of network data over time can help identify trends and aid capacity planning. Matrices and network topology maps can also help identify dependencies that can be vital to troubleshooting and resolving outages or bottlenecks.
Here’s a detailed look at some key benefits of network visualization:
- Improved network visibility. Network topology maps can give you total visibility into your entire network. As a result, you can understand the network architecture and device dependencies in detail. Dynamic, as opposed to static, network maps go a step further and automatically update when changes occur and often enable you to drill down and view granular data on traffic flows and resource utilization.
- Faster troubleshooting. You can’t fix what you can’t see. The visibility provided by network visualization like maps and performance graphs allows you to quickly understand where to focus your troubleshooting and root cause analysis efforts. Identifying why a user’s VoIP phone isn’t working can be as simple as finding it in your network map, seeing which switch port it is connected to, and checking that the port is configured for the correct VLAN.
- More informed network planning. Planning for network upgrades and refreshes gets easier when you understand your current network dependencies, inventory, and resource utilization trends. A tool that does real-time network asset management, and topology mapping and visualizes historical network traffic data can give you the information you need to make informed choices.
- Streamlined onboarding. There are two important aspects to onboarding in network roles. The first is speed. If you’re onboarding a network engineer to your team, the fastest way to make them productive is to make sure they understand the lay of the land. A quality network topology map does just that. They can see, down to the device and cable level, both logical and physical connections and quickly get up to speed on the environment. The other is new scenarios. Let’s say it’s you, and you’re learning a new network. Maybe you’re a network admin starting a new job, a seasoned network admin whose company has just completed an acquisition, or an MSP onboarding a new customer. Even if the previous engineers didn’t map the infrastructure, a network visualization tool with topology mapping and network discovery functionality can jumpstart your efforts to learn about and document the network.
- Better communication. The ability to quickly, clearly, and unambiguously communicate a lot of information in a way customers, managers, and engineers can understand and act on is no simple task. The right visuals can really help explain a situation clearly, so you can address specific problems.
Network visualization examples
Now that you know what network visualization is and understand its benefits, let’s take a look at some real-world examples.
Network maps
Network maps are one of the most popular types of network visualization and for good reason. We can’t overstate the importance of network topology. Maps can help visualize your entire network topology as well as the specific devices, physical connections, logical connections, rack locations, and even floor plans that comprise your network infrastructure. At a high-level, network maps fall into two categories: static network maps which provide an unchanging view of your network topology, and dynamic network maps which reflect changes in near real-time.
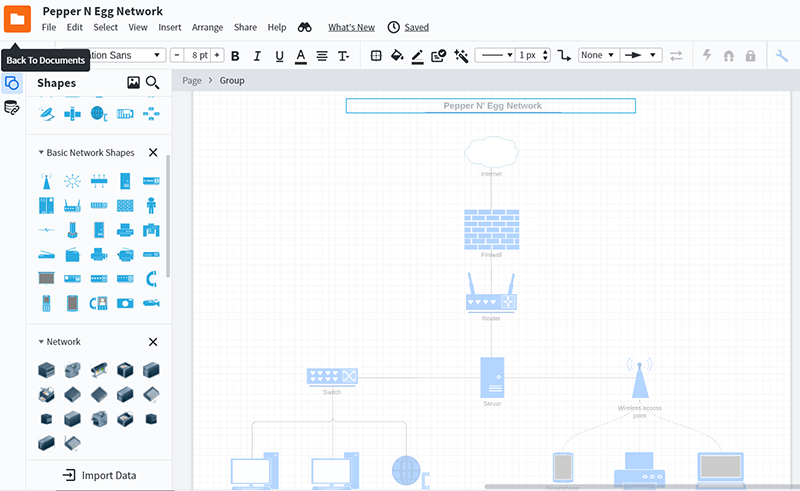
Static network maps
Although they’re more frequently called network diagrams, static maps can be created manually using tools like Visio or — as in the example below — LucidChart.
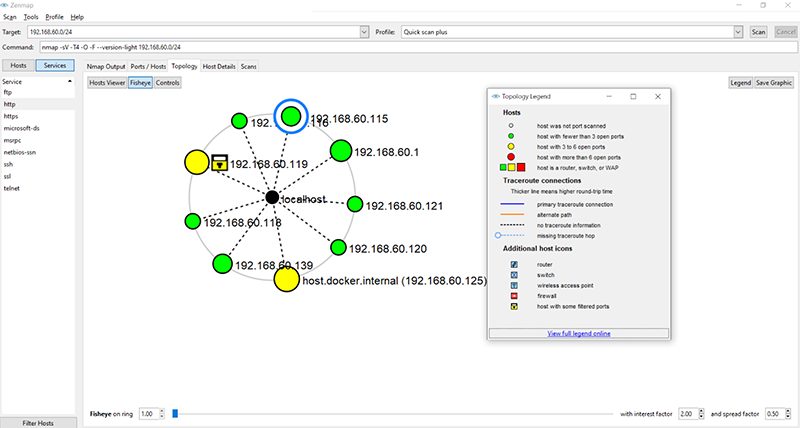
Static network maps can also be created by tools that perform network discovery like the appropriately named Nmap (Network Mapper). The benefit of coupling network discovery with network mapping is that you can use the discovery functions to create snapshots of the actual state of a network.
We’ve put together our round-up of the 7 best network mapping tools that to help find a solution.
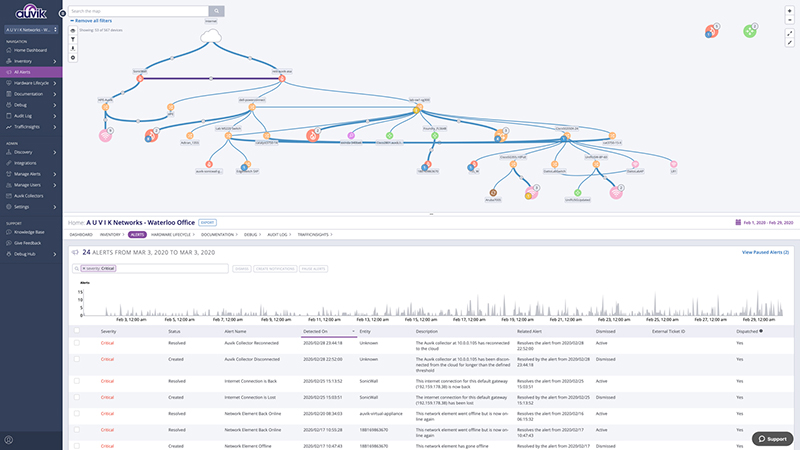
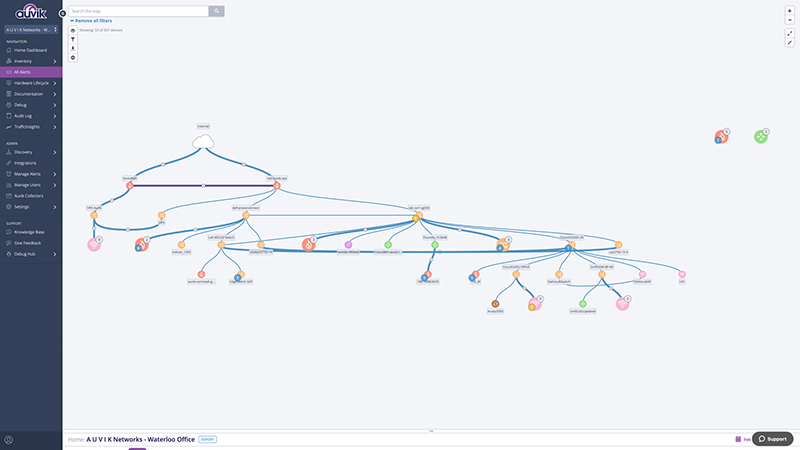
Dynamic network maps
Dynamic network maps add real-time data on network changes to the mix. While a static map is useful for understanding the intended network design, or even the state of the network at a specific point in the past, a real-time network map provides visibility into the current state of the network.
Generally, real-time dynamic network maps are interactive, allowing you to drill down and view specific metrics on connections, devices, and traffic flows.
Dynamic network topology maps can also have the benefit of being more detailed. Since the discovery and visualization processes are automated, there is no time spent drawing and detailing the network diagram. Where manual maps might stop at the switch level (since it takes more time to draw specific endpoints, and anything below it is changing regularly anyway), dynamic network maps will regularly depict right down to the endpoint level.

Network visibility solutions that provide network discovery and dynamic network mapping are significantly better network troubleshooting, change management, and analysis resources than static maps that must be manually updated.
Charts & graphs
Charts and graphs are an excellent way to visualize trends and compare sets of data. In the context of network visualization, there are a wide variety of charts and graphs that can help you better understand your network’s health. For example, metrics like interface utilization, bandwidth, and packet loss can all be graphed over a period of time. Similarly, charts can compare metrics between devices, interfaces, or time periods.
Dashboards
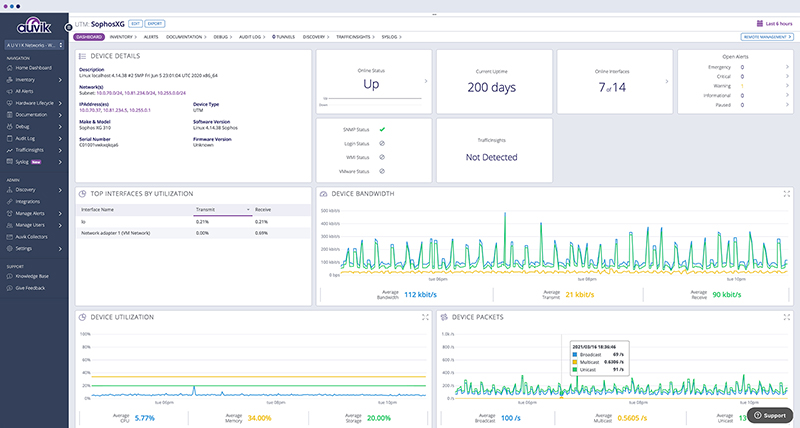
For useful information to be actionable, it needs to be easily accessible and digestible. Dashboards aren’t a specific type of network visualization per se, but rather an aggregation of important data on a single page that helps make important information easy to consume.
A well-designed dashboard should be information-rich but also intuitive enough that you can quickly understand the most important information. For example, Auvik’s main default dashboard provides you with information on open alerts, detected misconfigurations, and a graph of top device utilization among other metrics.
What is Network Topology Mapping?
Network topology mapping is the process of creating maps that visualize your network layout by creating a network map. Network topology mapping tools enable the automatic creation of network maps. As we know there’s a lot of value in dynamic network visualization, it’s worth taking a closer look at how network topology mapping works, so let’s jump in.
How are topology maps created?
Of course, you could create a topology map by hand (and we’ve got a helpful guide for that!), but other than for very small networks, doing so would be inefficient and error-prone. Your map would also become stale after the 1st change. Because of that, let’s focus on how dynamic network topology maps are automatically created by network topology software tools.
While the specifics will vary from tool to tool, the general process for creating a topology map is:
- The user defines network range(s) and credentials (e.g. for SNMP, SSH, and/or WMI) and begins a scan.
- The network topology software scans the networks to discover devices and the connections between them.
- A visual representation of the logical and physical connections is displayed to the user.
- When a change occurs (e.g. a link goes down) the map automatically updates.
More sophisticated network topology software will allow the user to drill down and capture specific data on devices within the network. For example, suppose you see traffic isn’t being routed to a specific VLAN. Using network topology software, you can often identify the root cause (like a misconfigured trunk port) by tracing the logical connections.
What are the benefits of network topology mapping?
Network topology software like Auvik can enable you to drill down from an overall view of the network to devices, to ports, in seconds. Along the way, you can see active alerts and detailed network metrics that enable faster troubleshooting and better decision-making. Additionally, you’re able to greatly reduce tech debt by automating your network documentation processes.
Getting started with network visualization
In most cases, network discovery and the creation of a dynamic network map is a good starting point for anyone new to learning to work with network mapping. With a dynamically updating map that allows you to drill down to the port level, you’ll quickly become a more effective troubleshooter. Additionally, if you’ve never had a full network map before, you’ll likely learn a thing or two about your actual network topology. From there, you can begin to focus on specific business and performance goals and the KPIs (key performance indicators) that matter most to you.
Ready to try bringing network visualization of your network to the next level? Try Auvik risk-free for 14 days, and see the difference it makes.
Your guide to selling managed network services
Get templates for network assessment reports, presentations, pricing & more—designed just for MSPs.


Hai,
Thanks for the elaborate explanation . I think you have been a revelation !
All the best !