
Every IT team has its own strategies, goals and objectives to help move themselves and their company forward. As part of this, management relies on the metrics and data reports from their networking department to signal all that effort is actually making progress towards goals and objectives. That data lives within the tools and systems used by techs every day. The challenge: how to best get that data out of those tools, and into a format that can be shared with management, executives, and other teams in ways everyone can understand and reference.
At Auvik, we’ve designed a set of APIs specifically for this kind of external reporting—including Alert History, Inventory, and Statistics APIs—to help our users have that critical information at their fingers tips quickly, and easily pull it out of our systems and into others.
How can I use Auvik APIs for external reporting?
With Auvik, there are several ways you can use our APIs for external reporting. We’ve listed them here in order from the easiest to deploy to the most technically challenging.
1. APIs for external reporting using fully managed solutions
The easiest way to start creating customized dashboards with data pulled by Auvik APIs is by working with a reporting tool that’s already natively integrated with Auvik. Auvik is currently integrated with multiple reporting vendors, including BrightGauge, Captain’s Chair, and Cloudradial.
Typically, connecting Auvik to our reporting partners can easily be done within their products by searching for “Auvik” in their integrations. Most vendors provide out of the box reports and templates to quickly get you started, along with comprehensive guides and instructions to quickly get going.
The ease of management is one key advantage in using our partner tools, and it’s a fantastic way to focus on your reporting story, rather than worrying about technical underpinnings.
2. Connecting business intelligence tools to APIs for external reporting
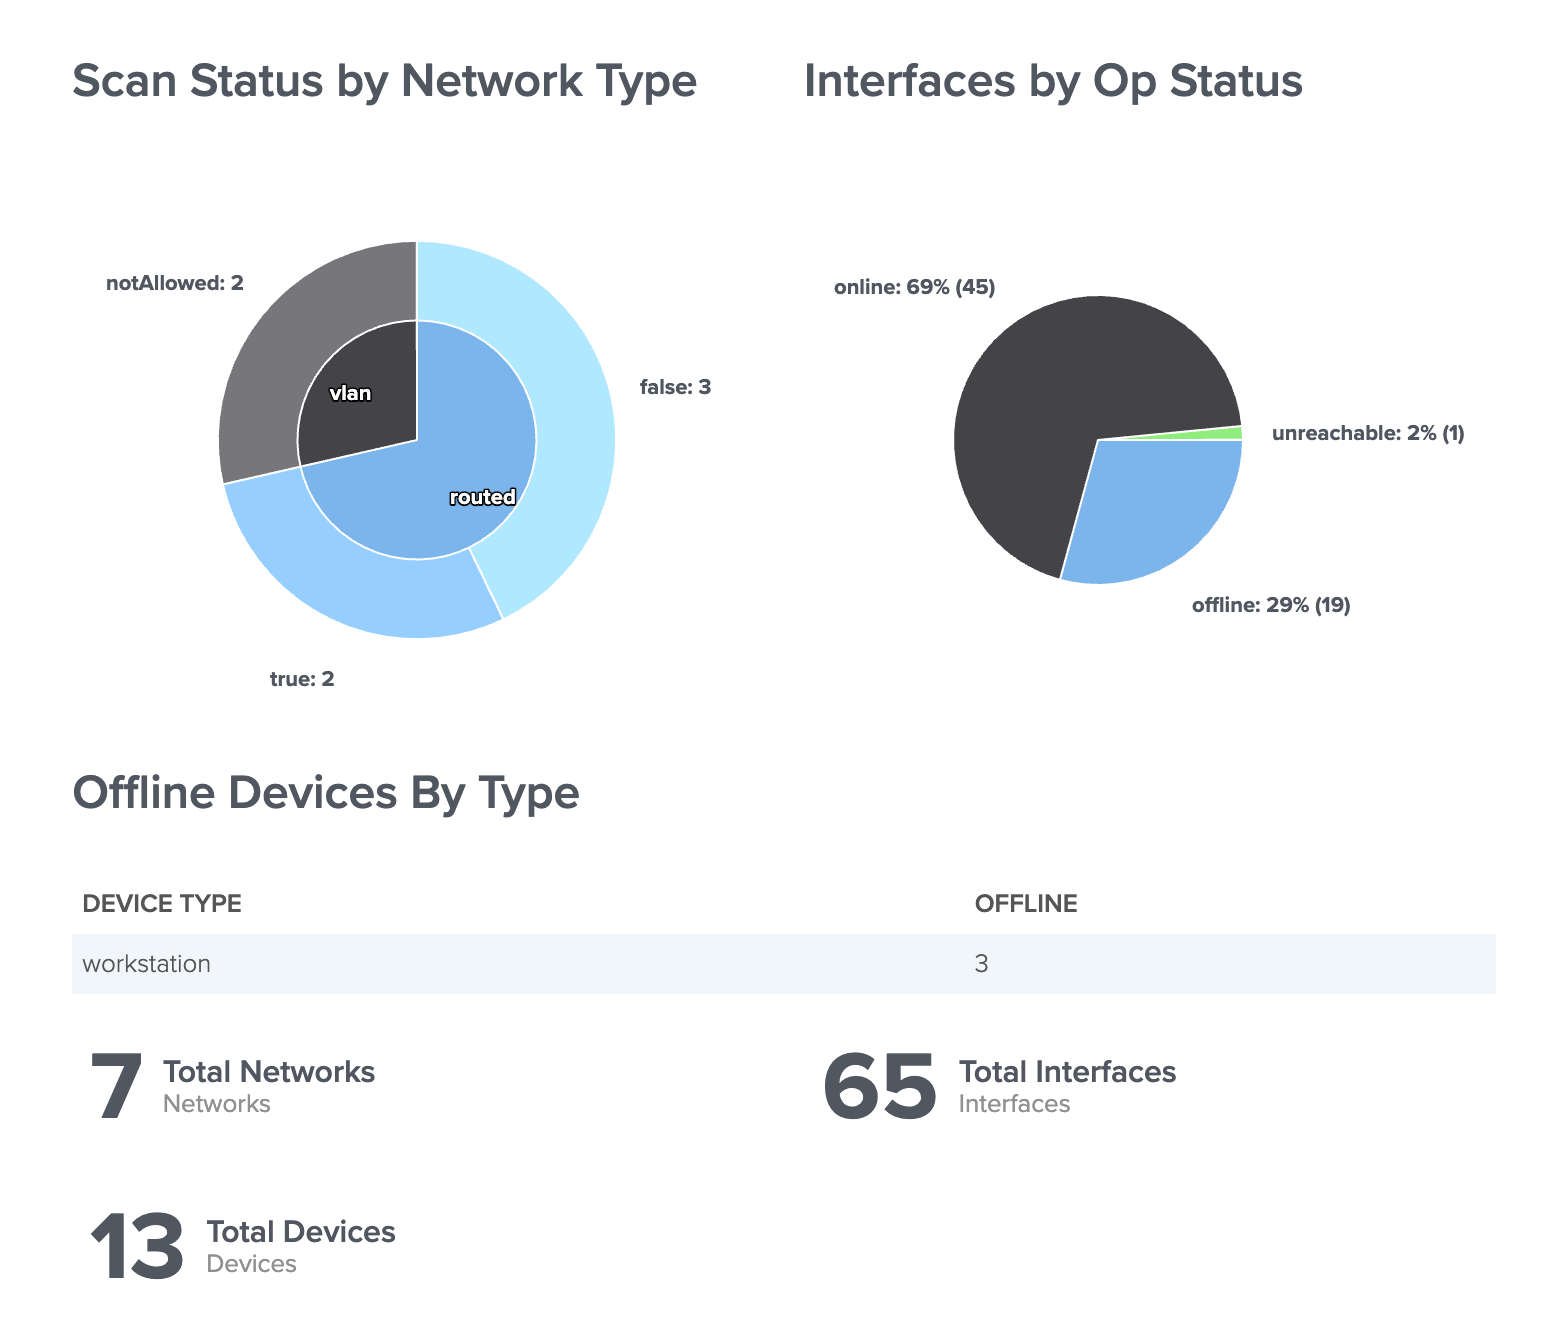
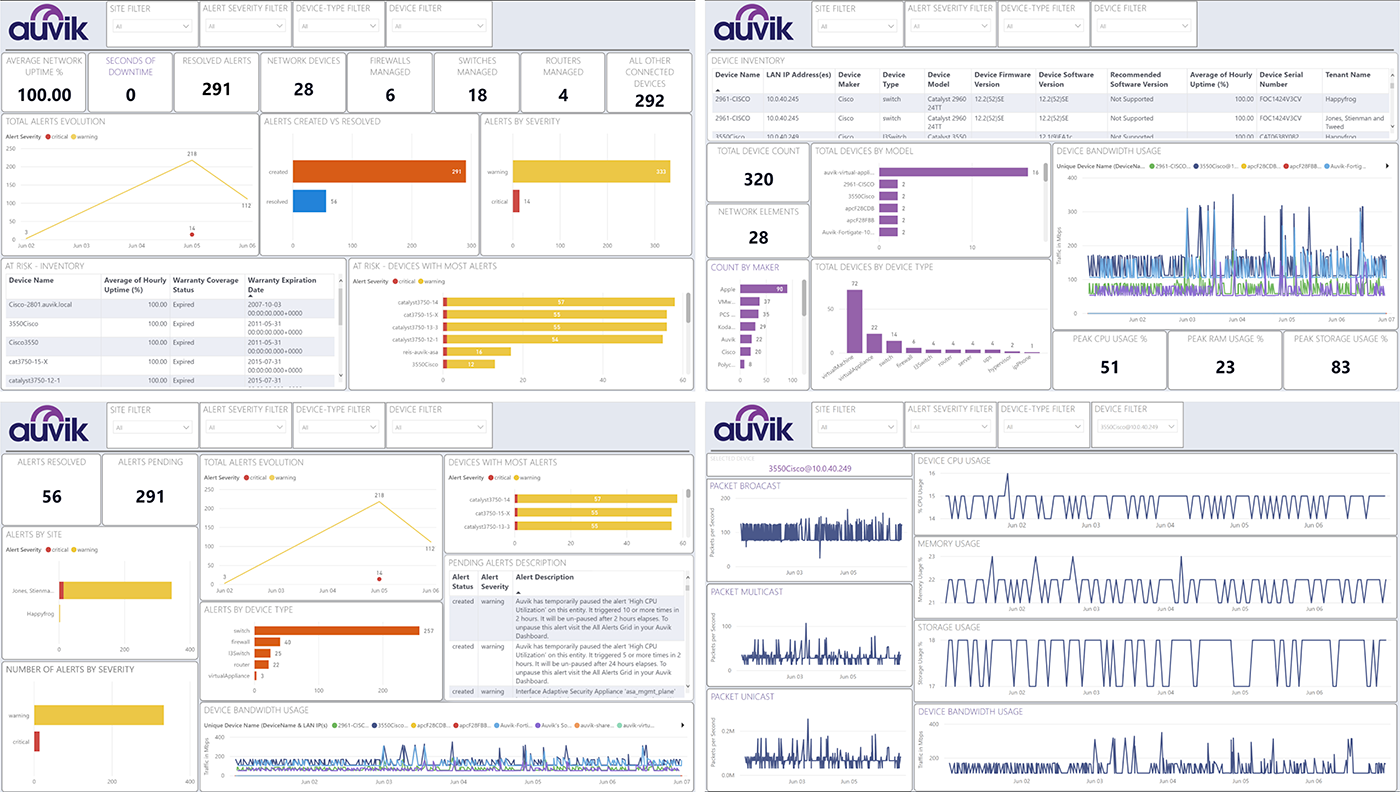
The second way to use the data collected through Auvik’s APIs is by leveraging business intelligence tools to create custom dashboards. Tools like Microsoft’s Power BI and Tableau simplify the entire reporting process, from pulling data from Auvik APIs to creating and sharing reports.
Auvik already has ready-to-go, always up-to-date templates that integrate with Power BI. We’ve provided an open source project for a Power BI reporting template so Auvik customers can get all the benefits of using a business intelligence tool for reporting while having to do none of the heavy lifting in the backend.
There are also more flexible options for use when it comes to common tools, such as Google Sheets and Excel. The scripting capabilities in Google Sheets (Google Apps Script) and Excel (PowerQuery) enable you to load data from Auvik APIs into a spreadsheet for performing simple calculations and charting.
Business intelligence tools are a great middle-ground option for reporting. The setup process gives you flexibility to create custom dashboards without having to write an entire application. Keep in mind, there’s a learning curve to setting up your dashboards, and a time commitment to managing the data to ensure it’s consistent.
Pulling data directly from APIs
You may be thinking, “Can’t I pull the data from the APIs directly for the most flexibility?” And the answer is yes, but the learning curve to do so can be daunting if you haven’t worked with APIs in the past.
Accessing data via APIs, as well as processing the data and feeding it into the right tool in the right format (or writing your own application to run it), requires a lot of learning and patience. However, if you have the right infrastructure and expertise in place, you already know the ins and outs of APIs, or your need to do it this way is important, we can help.
If this is your preferred route, there is extensive API documentation as well as access to our support team that can help with any challenges!
Find your own path
The right tool for reporting may evolve as priorities shift, team grows or your business evolves. We’re focused on providing you the right infrastructure, the strongest partnerships and tireless support in order to make you succeed at every step of the way.
Do you have a suggestion for how we can better support your external reporting needs with our APIs? We’re committed to developing the tools and features our users need, and that’s why we’ve introduced the Auvik Idea portal. The idea portal allows us to collect your suggestions while keeping you informed of what we’re working on, and what we’re planning to implement next. Share ideas with the Auvik product team, request new features, and vote on the ideas you really like.
The idea portal is live and available to every Auvik subscriber through your Auvik credentials. To access the login page, you can click the Idea Portal link under Resource Center on the left menu inside the Auvik product, or head directly to https://ideas.auvik.com.
Ready to see how the power of Auvik can help create reports with impact? Get your free 14-day Auvik trial here.
