

Network Path ANALYZER
Find the cause of connectivity problems faster
See the exact path traffic takes and the performance data at every hop, so you can pinpoint where a connectivity problem is happening and why.
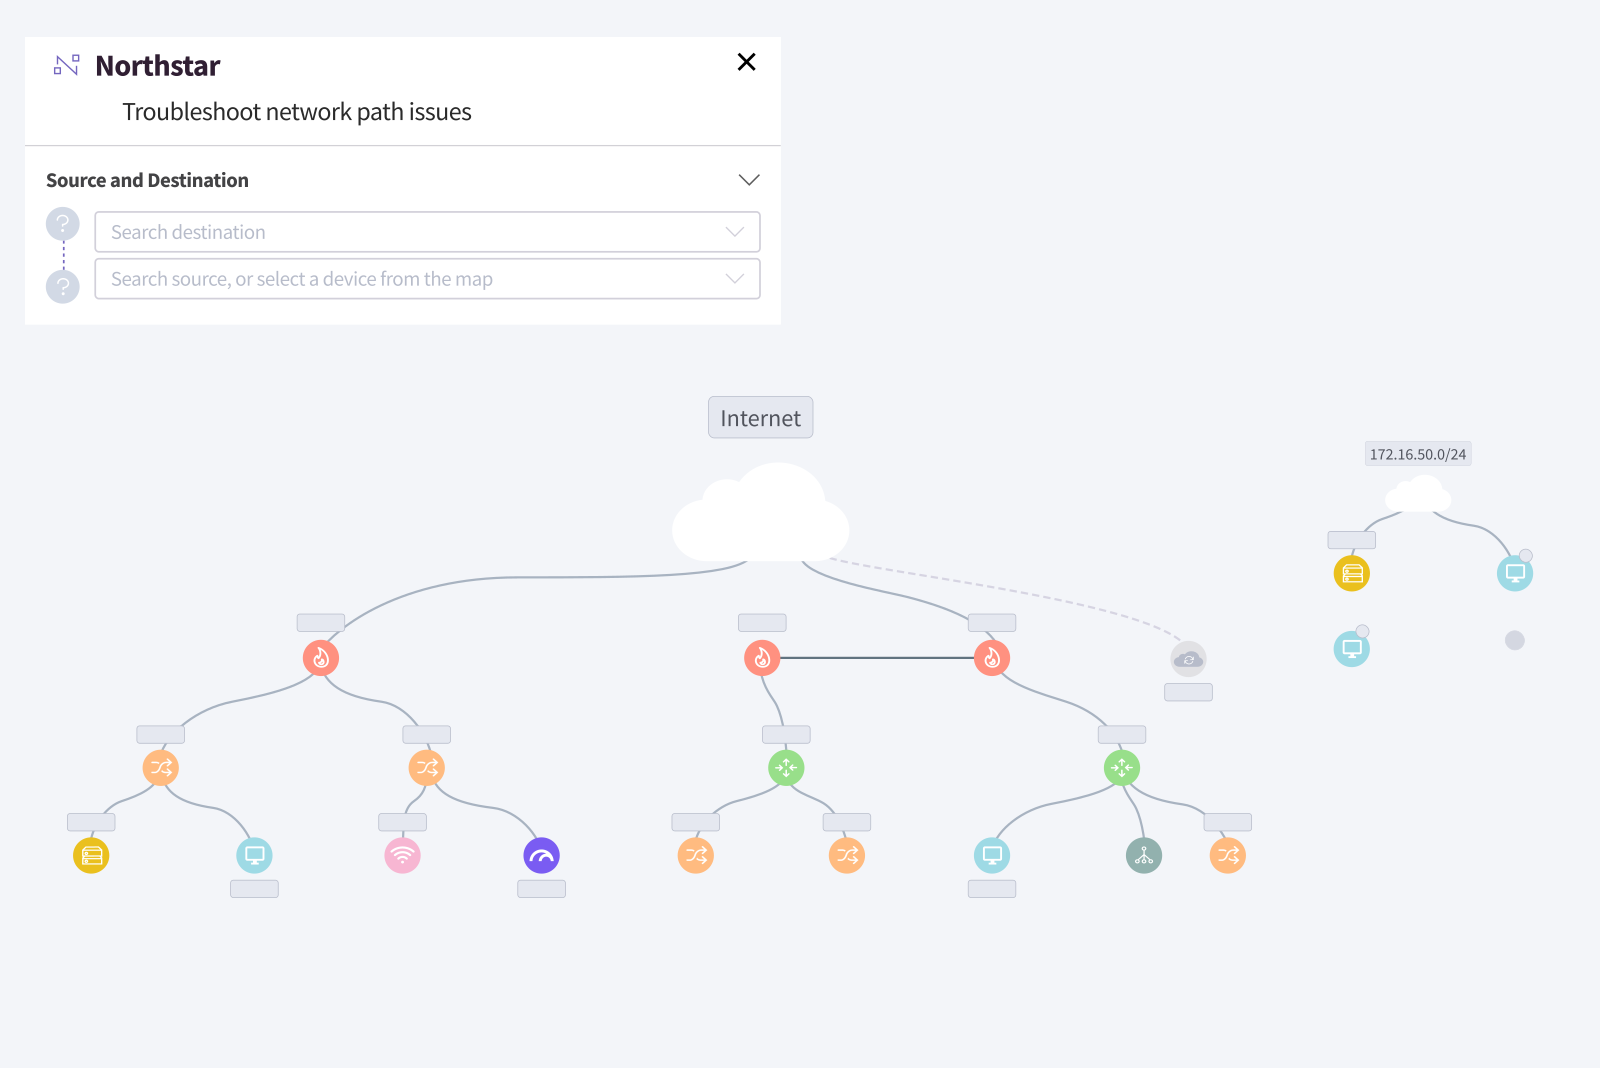
Spend your time fixing the problem, not finding it
When a user says, “I can’t connect,” see the actual path traffic takes and what’s happening at every hop. Pinpoint where the problem is and what’s causing it, so you can get to the fix faster.
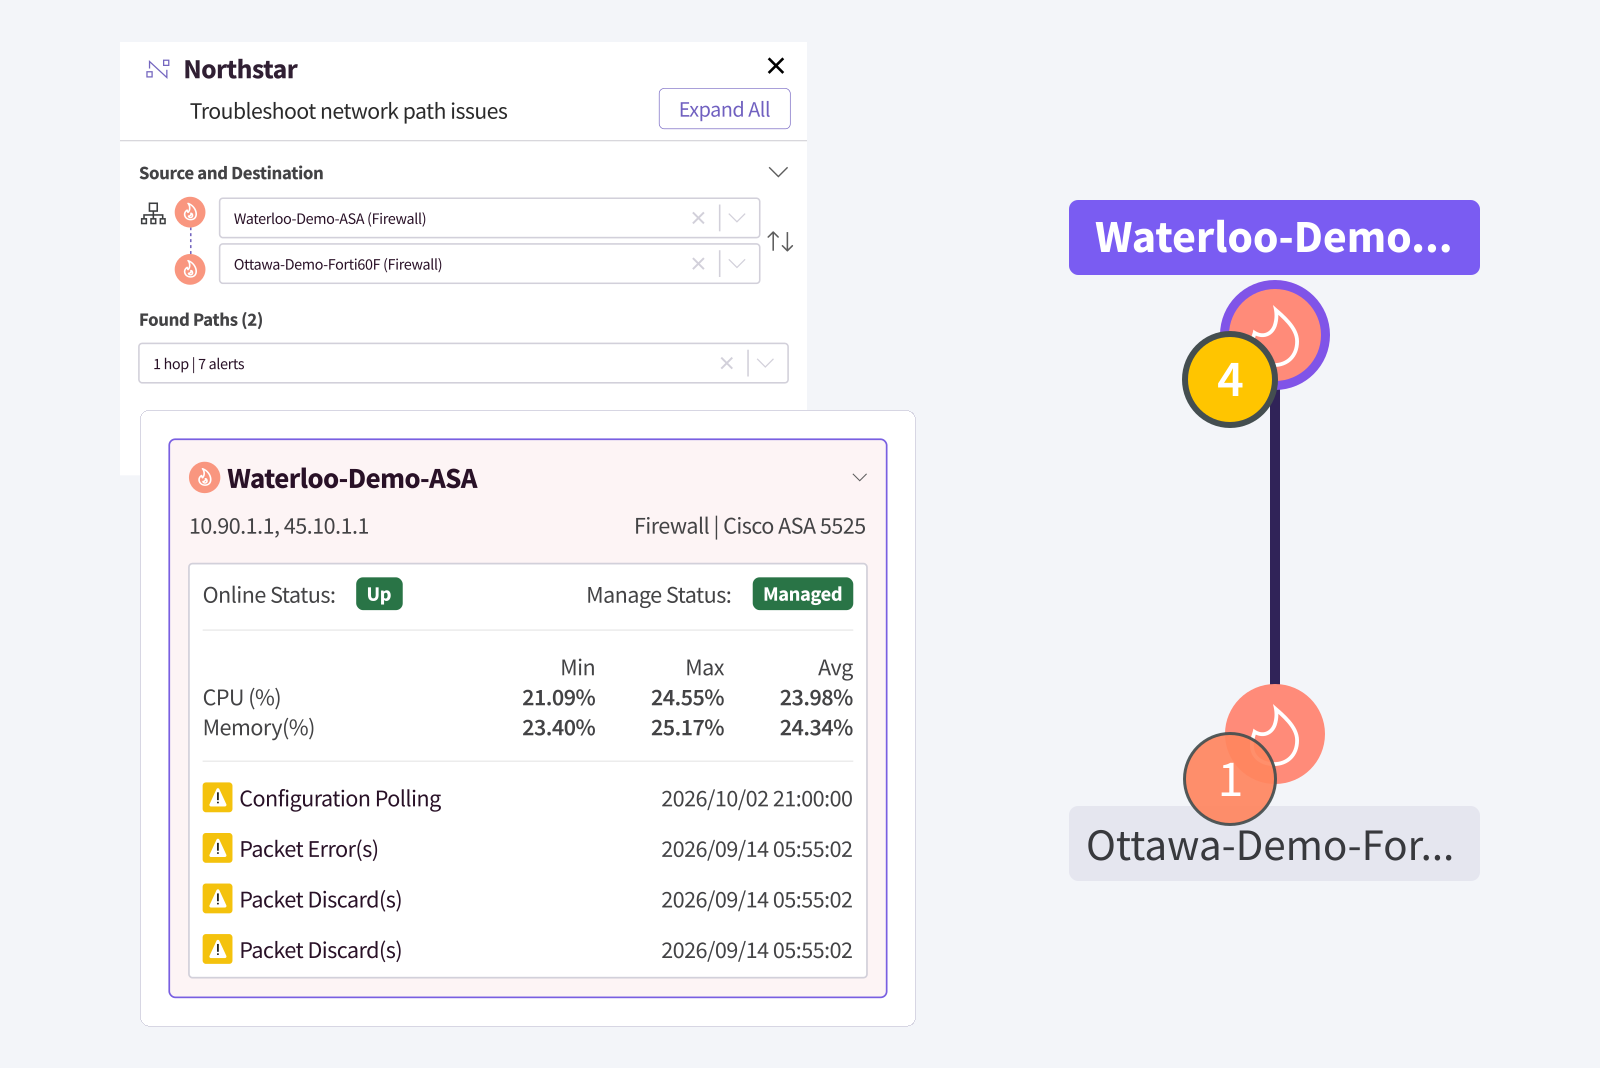
See the path your traffic actually takes
Isolate the actual path traffic takes between source and destination, so you can focus on the relevant hops instead of tracing the route yourself.
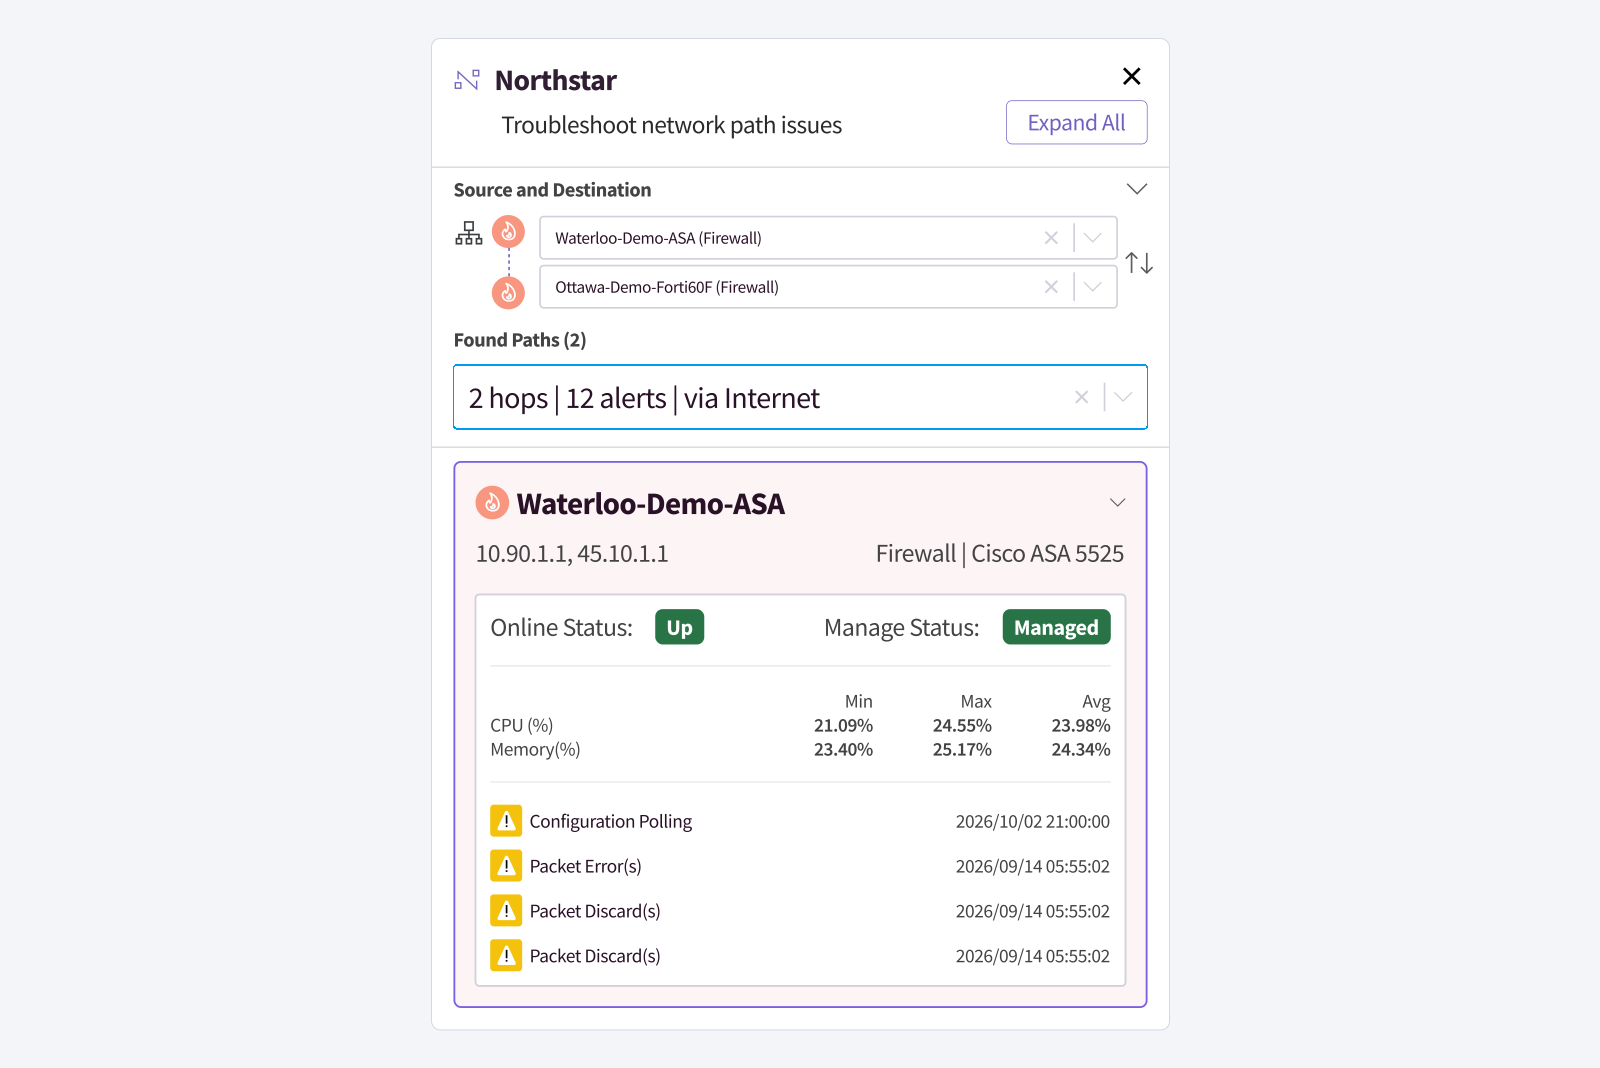
See what’s happening at every hop
See performance metrics and open alerts for every device along the path in one view, so you can quickly narrow down where the problem is and what’s happening.
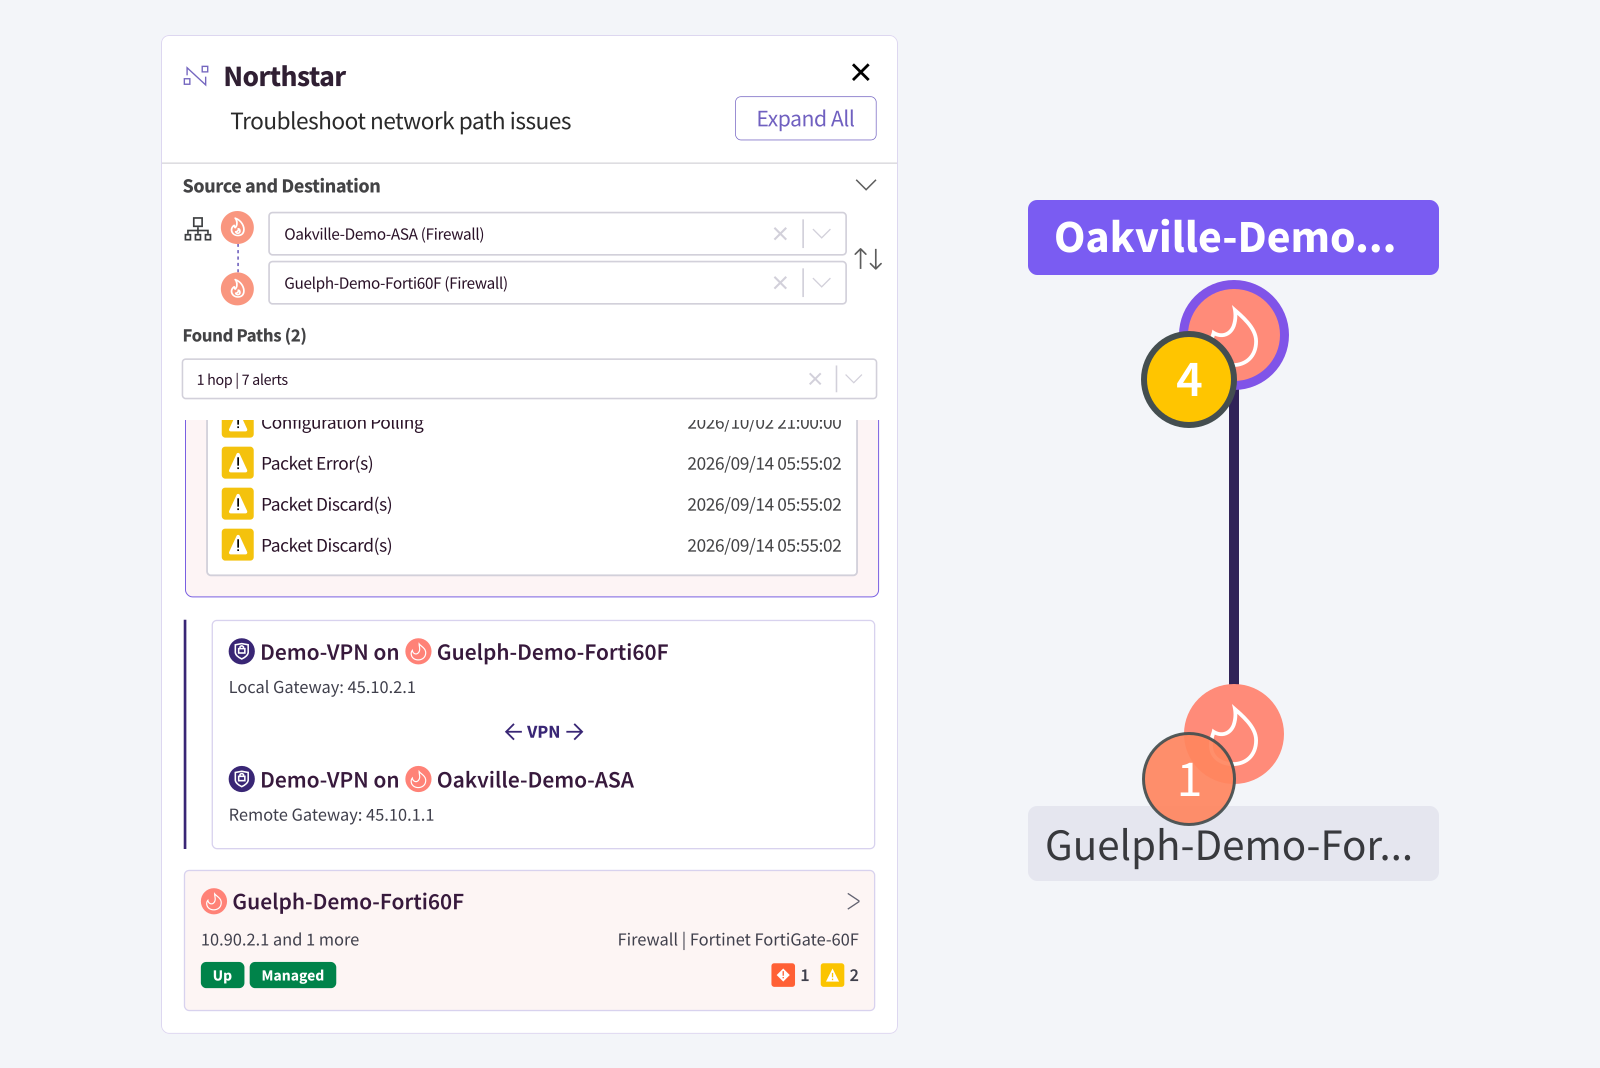
Troubleshoot intermittent issues after they happen
Look back up to 30 days at performance data and alerts to see what was happening along the path when the issue occurred.
Real reviews from real IT Teams
Loved by customers in independent reviews


Take the guesswork out of connectivity troubleshooting
Pinpoint connectivity problems instead of hunting for them
Stop checking devices one at a time to figure out where the problem is. See the actual network path and what’s happening along it so you can quickly narrow down the source of the issue.
Find the device that’s causing the problem
Your network map doesn’t always tell you the path traffic actually takes. See the actual hops between source and destination so you know which devices to investigate instead of guessing.
See what’s actually wrong with the device
Once you find the problematic device, use its performance metrics and open alerts to understand what’s happening and get closer to the root cause.
Troubleshoot issues that have already disappeared
See what was happening along the network path when the issue occurred, even if everything looks normal by the time you investigate.
Check out our latest network path analyzer resources
Network path analyzer FAQs
What is network path analysis?
Network path analysis shows the route traffic takes between a source and destination on your network. Auvik’s Network Path Analyzer visualizes the individual hops along that route and brings together performance data and alerts for the devices along the path.
Can I analyze a path between two devices on my network?
Yes. You can choose a source and destination device to see the network path between them. You can also analyze the path from a device to the internet.
What performance metrics can I see along the path?
You can see health and performance information for devices and interfaces along the path, including CPU and memory usage, packet discards, transfer speeds, and up/down status. Open alerts are also surfaced along the path.
Can I troubleshoot issues that happened in the past?
Yes. You can go back up to 30 days to see performance data and alerts along the network path, helping you investigate intermittent issues that aren’t occurring when you’re actively troubleshooting them.
Can I see more detail for an individual device or interface?
Yes. You can expand individual devices along the path for additional information and select devices or interfaces to drill into their details.
Are cloud controllers included in network paths?
No. Cloud controllers aren’t included in Network Path Analyzer paths because they aren’t classified as devices in Auvik.