
Despite everyone’s best efforts, network failures happen. And when downtime means lost productivity, fast troubleshooting becomes an integral part of IT operations. So with the addition of SNMP poller history, Auvik providing users an archive for troubleshooting, analysis, and planning.
When it comes to managing network issues, diagnosing the root cause is the first step. And often, there’s a gap between when an incident occurs, and when it’s reported.
And herein lies a big problem: if you don’t know the state of a faulty device(s) at the time trouble begins, you aren’t likely to produce a permanent fix.
Knowing the historical metrics of a device’s components is critical. Because without the data, IT has to spend time both reproducing the incident and then capturing values in real-time. Having that information already on hand, through the ability to access and store historical SNMP monitor results, greatly reduces diagnosis times, and helps drill down to the root cause of an issue.
What is SNMP?
Simple Network Management Protocol (SNMP) is one of the basic ways networked devices share information with one another. An SNMP system that creates a managed network consists of at least three components: Managed devices, SNMP manager, and SNMP agent. The SNMP manager, also known as the network management system (NMS), requests and processes information from agent software that runs on managed devices such as workstations, routers, switches, and more.
What is an SNMP poller?
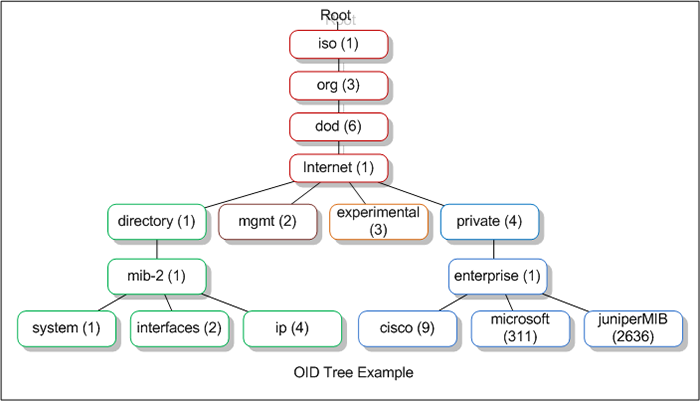
An SNMP poller is a tool that leverages the Simple Network Management Protocol (SNMP) to collect data from SNMP-enabled devices such as current state, configuration, and additional statistics such as CPU load on a workstation. The structure of the data uses a tree-like format that consists of multiple tables called Management Information Base (MIB) that categorize the data that can be queried and subsequently analyzed. The individual data pieces within a MIB are called Object Identifiers, or OIDs.
SNMP polling helps network engineers monitor and troubleshoot network issues by collecting data frequently to provide insights relating to the causes of a network disruption.
What about SNMP traps? Read more about this type of notification.
Auvik’s SNMP Poller
Auvik added the ability to store and view the history of SNMP poller in your device. This was one of the most highly-voted suggestions from the Auvik Idea Portal.
Auvik now collects and shows the historical values for SNMP poller in the following ways and stores them for one year:
- For numeric monitors, a time series graph is shown.
- For string monitors, a table of all values or a table of updates is available.
1. Numeric monitors
A time-series graph is shown for numeric monitors, such as device temperature. To set the unit display name in the graph, you can edit the existing monitor setting to specify the units.
2. String monitors
Historical values of a string monitor can be displayed as a changelog for values, such as the last diagnostic date, or as a table of values for metrics such as status.
How to view SNMP poller data in Auvik
By default, Auvik will gather a number of SNMP OIDs from your devices. But if you’re not seeing what you need, you can always add your own custom OIDs. To add your own, just follow these steps:
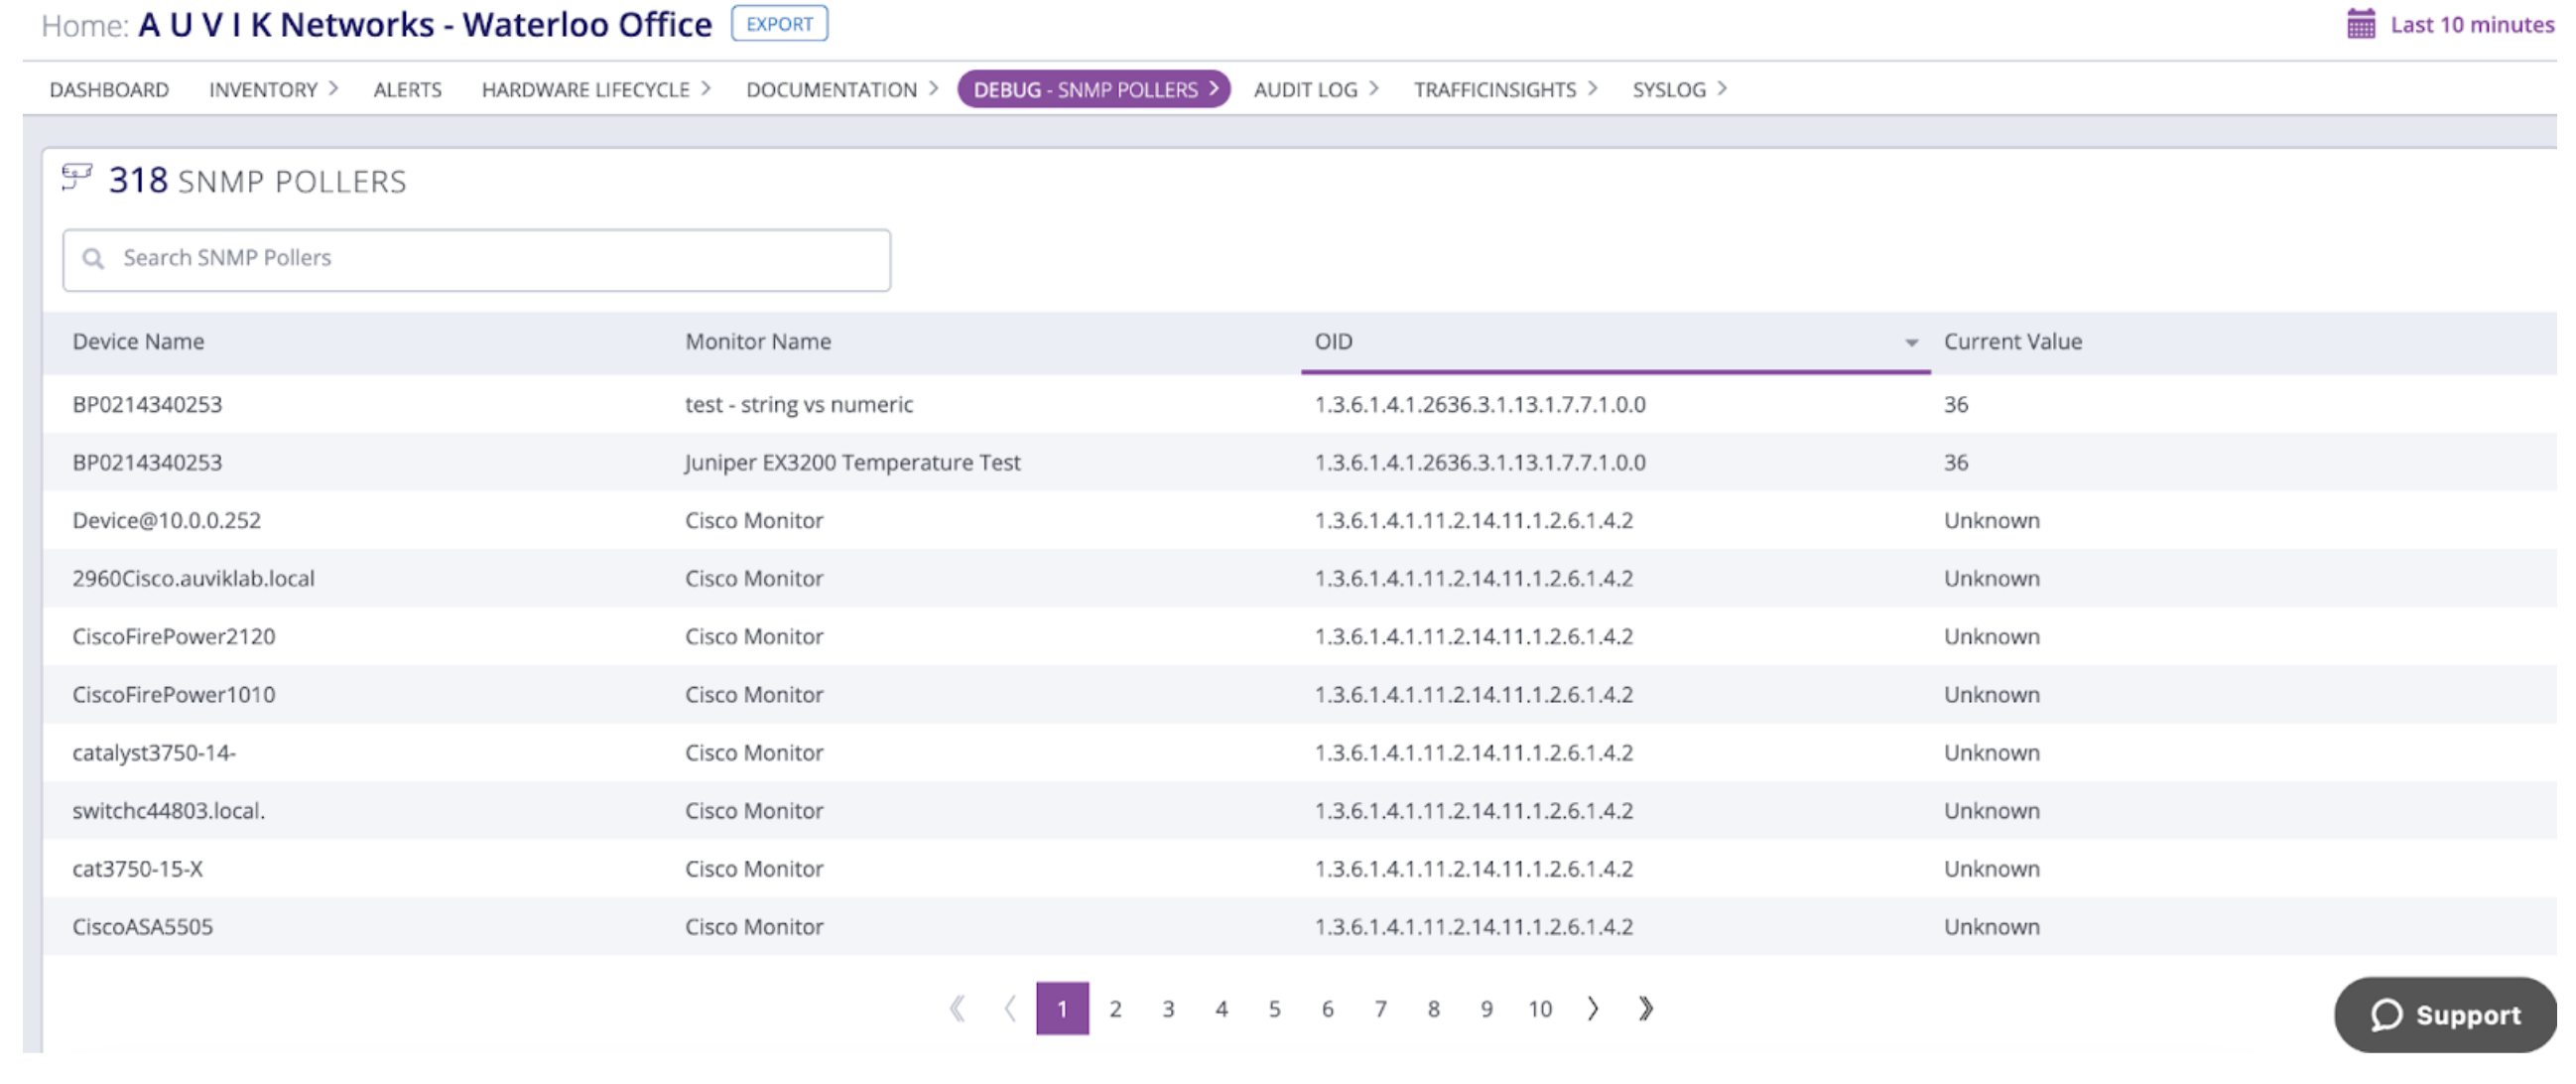
- To access a complete list of specific SNMP pollers for a site, select Debug in the side navigation bar.
- Click All SNMP Pollers.
- Click on the row to see the historical view.
- Use the option at the top right to select the date range.
If you’re looking for the list of custom OIDs set up for a specific device, click on the Debug tab from the device dashboard, and from the drop-down menu, click SNMP Poller.
Why you need SNMP poller history
Auvik is constantly monitoring and polling your network to give you real-time, deep visibility at a single point in time. With historical monitor data, you can troubleshoot transient issues faster. Some examples include:
- Troubleshoot call failures by looking at the history of the number of simultaneous call connections, SIP status, and number of SIP registrations
- Troubleshoot incidents with memory utilization
- Troubleshoot file storage incidents with the history of used disk space and status
SNMP poller history can be used to observe trends such as capacity usage or to estimate disk life. Confidently plan for future capacity and infrastructure needs based on historical trends. Create your own custom alerts based on the values obtained from the SNMP poller, and choose how often you want to receive notifications for each one.
Do you have other interesting use cases? Please comment on your ideas below.
We’re committed to developing the tools and features our users need, and that’s why we’ve introduced the Auvik Idea portal. The idea portal allows us to collect your suggestions while keeping you informed of what we’re working on, and what we’re planning to implement next. Share ideas with the Auvik product team, request new features and vote on the ideas you really like. The idea portal is live and available to every Auvik subscriber through your Auvik credentials. To access the login page, you can click the Idea Portal link under Resource Center on the left menu inside the Auvik product, or head directly to https://ideas.auvik.com.
And if you aren’t yet an Auvik user, now is the time to try. Take our 14-day, risk-free trial of Auvik now.
Your guide to selling managed network services
Get templates for network assessment reports, presentations, pricing & more—designed just for MSPs.

