When something goes wrong in your network, you often don’t find out about it until your users are affected. By then, you’re on the receiving end of an angry phone call and you’re left scrambling to identify the issue and understand its root cause. As soon as you hang up (if the affected user even lets you hang up), you’re in a race against the clock. As you jump between separate applications to get a grasp on device metrics, network traffic, and device logs, time ticks by, your mean time to resolution increases, and your network users are kept out of commission.
With Auvik, you can dramatically shrink the mean time to resolution of network issues and spare your network users from prolonged downtime by streamlining your troubleshooting process. Here’s how.
Step 1: Use the map for context
Your first stop in any troubleshooting scenario should be the Auvik map. From the Auvik map, you can immediately see who’s affected by the network issue, which devices are affected, and which devices are triggering alerts.
If you already know which device you’re looking for thanks to a specific complaint, you can use Auvik’s search feature to zero in on a specific network segment or device on the map by typing in its device name or type, vendor, network, interface name, IP address, or MAC address.
Alerts appear directly on top of affected devices on the Auvik map so you can see where you need to focus and identify any other devices your problem device is connected to. By clicking on the alert indicator, you’ll immediately see all of the alert details, including things like high CPU utilization, interface status mismatch, packet discards, and more.
Step 2: Triage any connectivity issues
If the affected device is showing offline in Auvik, you likely have a physical connectivity issue. But if the device is online, you have to identify all of the other devices the endpoint relies on for connectivity.
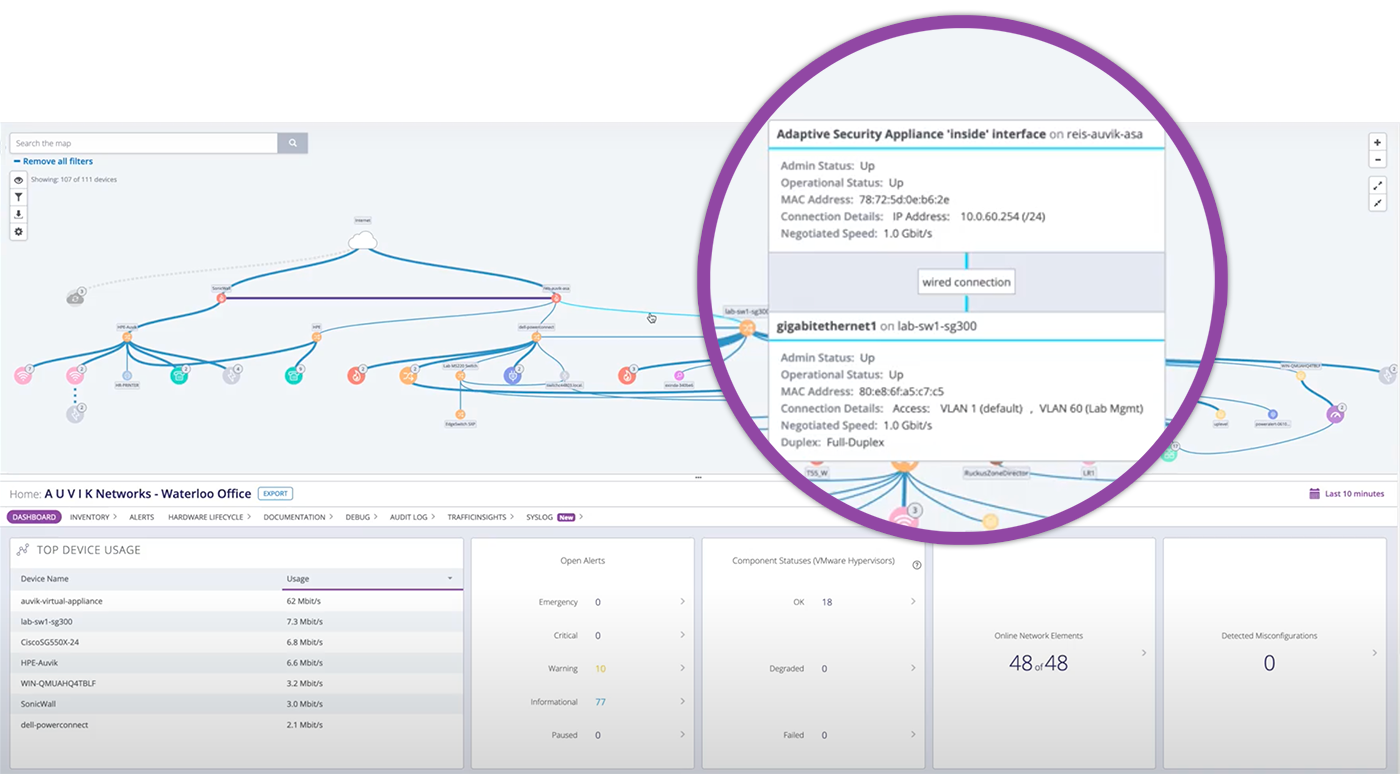
On the Auvik map, you can see all of the physical and logical connections that exist between devices. All you have to do is hover over a wire to see details about the connection, its operational status, its MAC address, and the interfaces on each end.
Auvik is already performing a health check on all of the devices your endpoint is connected through, so a quick check on the upstream network devices’ dashboards will ensure they’re performing the way they’re supposed to.
If you’re seeing that devices are offline, then you know where to start. If you’re seeing some alerts triggering, then you’ll want to investigate those first.
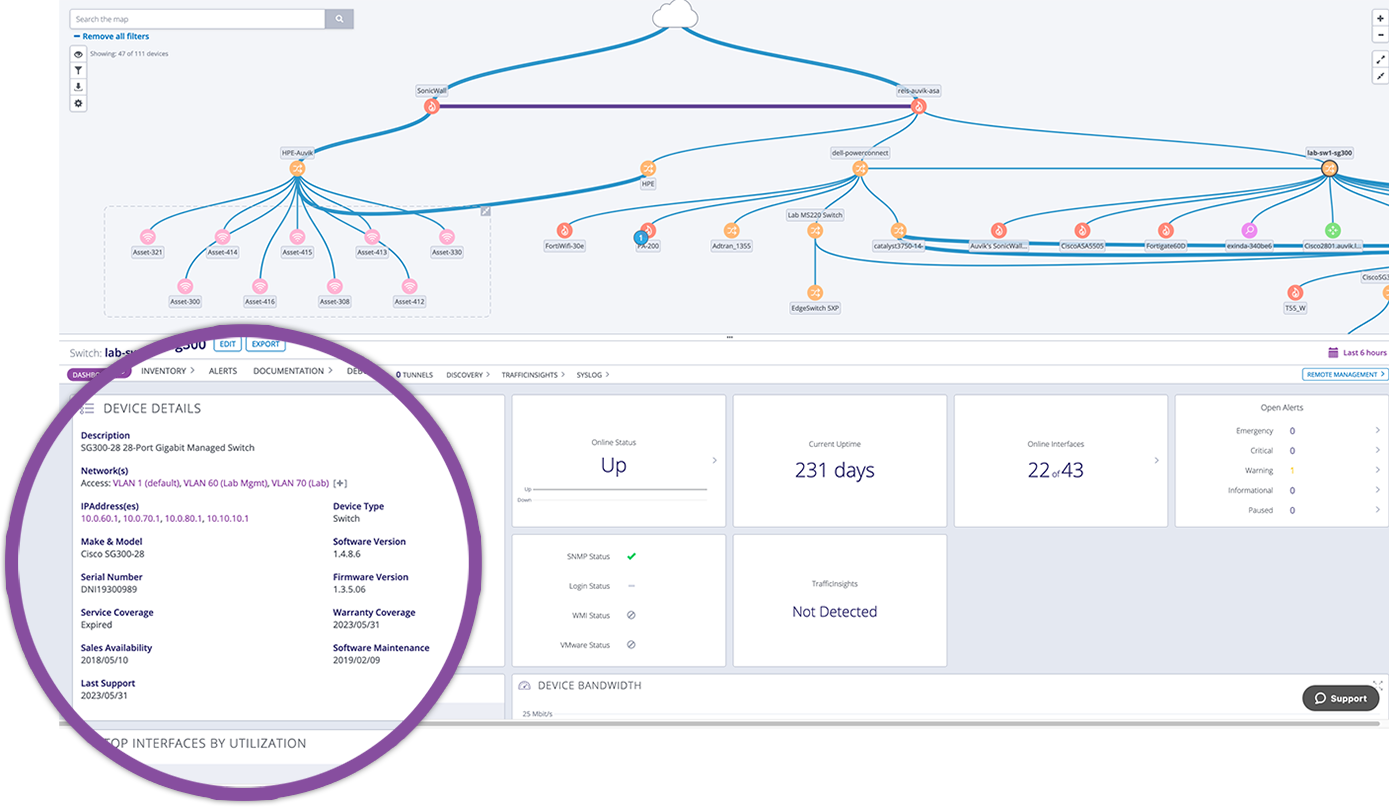
Step 3: Perform a health check on the affected device
In a previous article I wrote about troubleshooting connectivity issues with Auvik, I recommended asking yourself the following four critical questions when performing a health check:
- What’s the throughput on the device? Is it near the max capacity? Is it higher than normal?
- Is there one interface that’s placing the majority of the load on a switch? Is one misbehaving device or user impacting the entire network?
- Is there more than normal broadcast traffic occurring on the switch?
- How are the key device utilization metrics compared to their norms? Has the CPU utilization increased? Is the memory near its limit?
Through the device dashboards and the alerts in Auvik, you’ll have the answers to all of these questions in a matter of seconds. And if you’re not sure what to do when you encounter a specific alert—or you’re unclear about what a specific condition means—Auvik has you covered through our Knowledge Base articles on all of our pre-configured alerts.
You’ve just started knocking down your mean time to resolution, now that you have enough context to know if you’re dealing with a device performance or throughput-related issue.
Step 4: Investigate performance or throughput related issues
So you’ve narrowed it down to a performance or throughput related issue. It’s time to turn to Auvik TrafficInsights™. TrafficInsights is Auvik’s network traffic analysis feature that can collect and analyze flow data from any device supporting NetFlow v5 or v9, IPFIX, sFlow, or J-Flow.
Using machine learning, TrafficInsights complements flow data with additional metadata—like source and destination geography—to give you granular insight into the applications and protocols being used so you can really understand the traffic. When traffic flows through a TrafficInsights-enabled network device, then you can see who’s on the network, what they’re doing, and where their traffic is going.
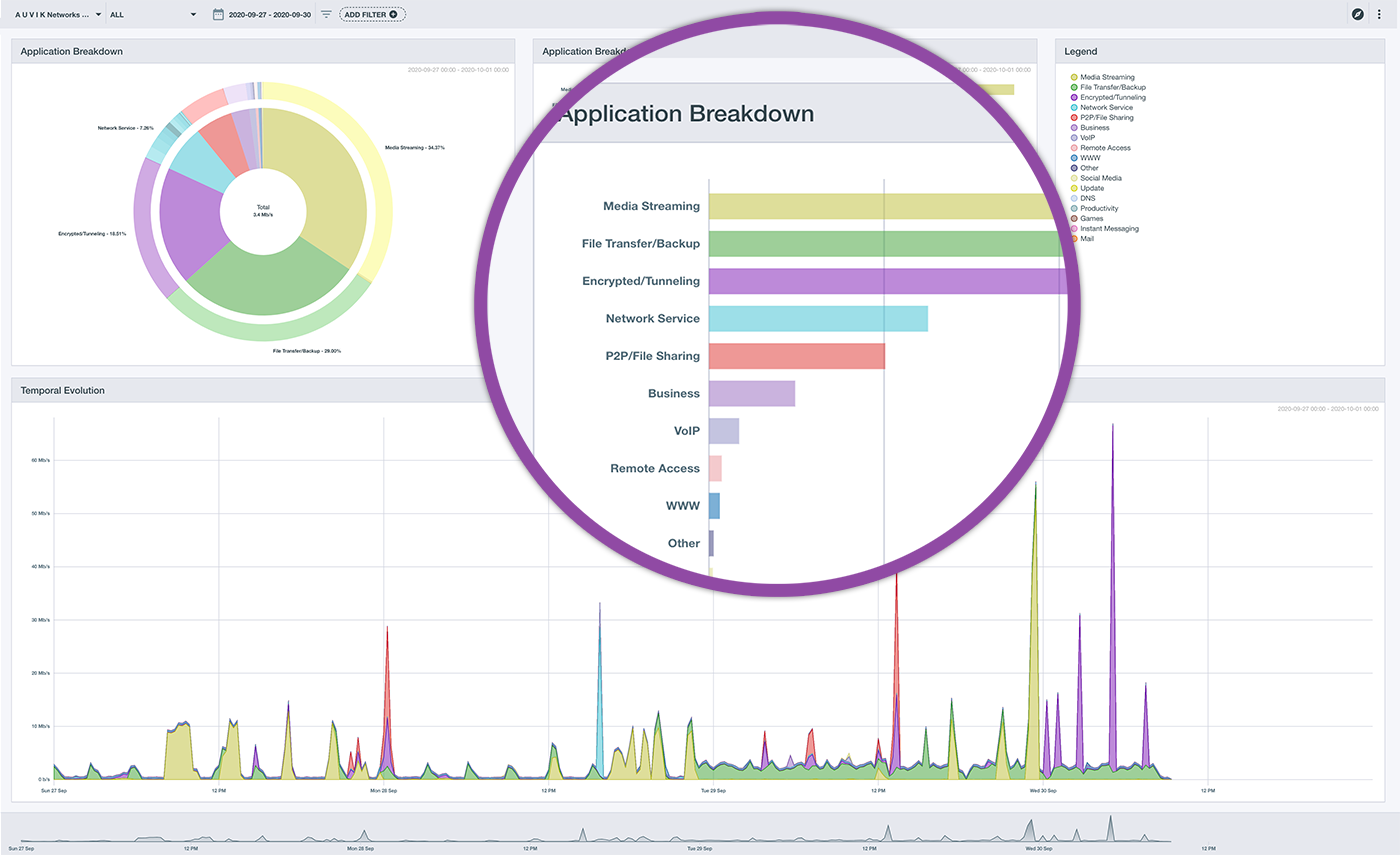
Equipped with this information, you can determine if any unusual network traffic is legitimate or not, and narrow down your course of action:
- If it’s legitimate business traffic, it’s time to invest in the network and increase your network capacity.
- If it isn’t legitimate business traffic, it’s time to look towards implementing employee fair use policies, QoS (quality of service) policies for users or application categories, or technical controls to block that traffic that just shouldn’t be there.
In some scenarios, you may not find any unusual traffic on the network at all, which rules out anything performance or throughput related. But, fortunately, that’s not the end of the troubleshooting line with Auvik. On to the fifth and final step!
Step 5: It’s not performance related… but something’s still up
If you’ve completed steps one through four and still haven’t resolved your user’s issue, the answer may lie in the device logs.
Auvik centralizes Syslog data for all your network devices across all your sites, allowing you to view, search, and filter the logs to get to the root cause of network issues.
If you know the exact time the network issue began, you can refine your searches down to the second using the Syslog time selector. If not, an approximate range will do so you can limit the number of logs you have to sort through.

If you don’t see anything obvious right off the bat, you can further narrow your search using the severity filter. If you need help from a device manufacturer’s technical support team, you can export the logs as a CSV file to send it to them.
Psst! Want to know the fastest way to reduce your mean time to resolution?
Your guide to selling managed network services
Get templates for network assessment reports, presentations, pricing & more—designed just for MSPs.