
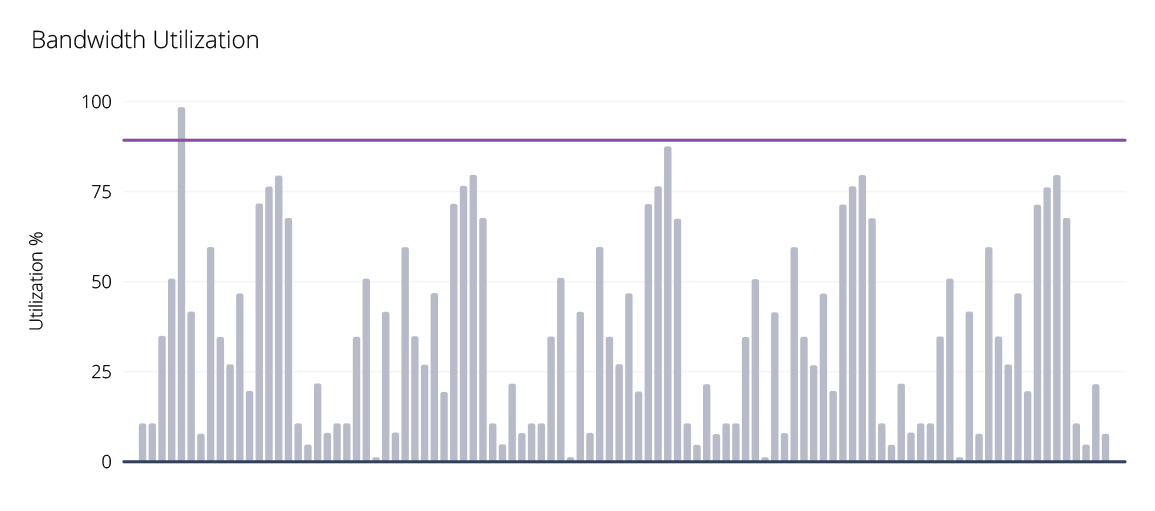
One of the largest challenges with network bandwidth metering is the way traffic flows. Traffic comes in bursts. It’s never a constant, predictable stream of data you can measure once, spec hardware for and be done with (wouldn’t that be nice?!).
Instead, you need to account for the dynamic nature of bandwidth utilization and its impact on performance. You’ll never be able to predict every burst of traffic your network experiences. But, with effective performance monitoring, you can significantly improve both your capacity planning and management now and into the future. Tracking bandwidth utilization peaks and averages is useful data, but those metrics can’t give you a complete picture on their own.
For that, we’ll take a look at the concept of “the 95th percentile” bandwidth metering, a method of measurement and planning that can help you better understand and manage capacity in your network.
Try Auvik Network Management
Free to try! Setup takes less than 15 minutes and you will see results in an hour.
What’s the 95th percentile?
In networking, the 95th percentile is the highest value remaining after the top 5% of a data set is removed.
For example, if you have 100 data points, you begin by removing the five largest values. The highest value left represents the 95th percentile. Once you’ve removed the outliers — those five points that are likely to be far from the norm — you’re left with a much more accurate picture of what network capacity conditions will be “most of the time”.
Before we get any angry comments from statisticians, our definition is admittedly a little different from percentiles in pure statistics. Why is the 95th percentile different in the network engineering world? Because it has its roots in burstable billing from Internet Service Providers (ISPs) and mobile networks.
In simple terms, with burstable billing, providers take samples of usage and throw out the top 5% before applying overage charges. The remaining samples are used for billing purposes.
How does the 95th percentile apply to networks?
With burstable billing, you can see why the 95th percentile matters to ISPs or customers billed based on this kind of network bandwidth calculation. But, if you’re using network monitoring tools that already tell you peak and average bandwidth utilization, why care about the 95th percentile? Because peaks and averages alone don’t tell the whole story. This is particularly true when bandwidth utilization is becomes highly variable.
Sizing network links based on peak utilization that occurs less than 1% of the time can be wasteful. Conversely, network bandwidth planning based on averages can miss significant spikes. For example, despite identical average bandwidth utilization, a network that is at 90% of utilization half the time and 0% the other half isn’t the same as one with 45% utilization all the time.
The 95th percentile helps you get a better idea of your network bandwidth requirements, well, 95% of the time! You’re not sizing to an average, and you’re not biased by outliers in the data. By looking at your 95th percentile range, you get a better idea of what your day-to-day bandwidth requirements really are.

How to calculate your 95th percentile
In general, there are multiple valid ways to calculate percentiles. For example, both Microsoft Excel and Google Sheets support a PERCENTILE.EXC function. However, we want a simple method that works for our network-focused goals. For that purpose, here is an easy method to calculate the 95th percentile:
- Collect bandwidth utilization samples over a period of time. For example, use SNMP to capture the data every minute for a week. At the end of the week, you’ll have 10,080 samples.
- Sort the values from highest to lowest.
- Remove the top 5% of values. If you have one week’s worth of polls every minute, that means removing the top 504 values.
- The remaining highest value is your 95th percentile value.
The basics of network bandwidth metering
Of course, your 95th percentile bandwidth metering alone won’t be the only thing you need for capacity planning. Fundamentally, you need to know your performance goals and projected bandwidth consumption. While that sounds simple at the surface level, it isn’t. Every network is different and existing performance, requirements, and budgets will influence your decisions.
Fortunately, there are some basics of network bandwidth planning that serve as a good reference in most cases, so let’s start there.
7 key things to consider for network bandwidth planning
1. The physical design of your network. A network device inventory and network map can help you better understand the physical layout of your network. If you don’t have visibility into what’s currently deployed, you might miss obvious reasons for bottlenecks such as an older switch with limited backplane bandwidth.
2. The logical design of your network. In addition to the physical layout of your network, the logical flow of your data matters a lot as well. Rerouting some traffic from overutilized links to underutilized links could help resolve some capacity issues.
3. Current network performance. Baselines are a must when it comes to projecting future bandwidth utilization and separating bandwidth issues from other network problems. In addition to 95th percentile performance, average and peak bandwidth, metrics like latency, jitter, packet errors, and packet loss can help.
4. Types of network traffic. Not all traffic is created equal. For example, VoIP traffic is more latency-sensitive than email. Visibility into the types of traffic on your network enable you to get a detailed understanding of exactly what users are doing, and where you need to prioritize your efforts. Exactly what “your efforts” are could be anything from upgrading bandwidth, to implementing QoS, to blocking users from hogging bandwidth streaming Netflix on their work PCs. Flow protocols and network traffic analysis tools can go a long way here.
5. SLAs and performance requirements. If you have predefined SLAs with end users or clients, quantifying them is a must from a capacity planning perspective. Even if you don’t have any external commitments, you should set some thresholds for what your organization deems as “acceptable”. Agreeing to minimum requirements before there’s a problem can minimize finger pointing and ensure all stakeholders are on the same page when issues arise.
Tip: Configure and alert against peak utilization thresholds in your network monitoring tool.
6. Existing user pain points. The network exists to enable end user productivity. Even if you’re hitting your SLAs and performance metrics, it’s important to understand major end user pain points. For example, suppose teleconferences are experiencing regular connectivity issues. If you find out this is consistent with server backup schedules, you might be able to boost productivity without any hardware changes. Knowing the problem exists allows you to identify potential solutions.
7. Expected growth. Simply put: given what you know, how much do you expect bandwidth utilization to increase or decrease over the network’s lifecycle? Include a cushion for this amount in the planning stages.
How do you know your network bandwidth is in trouble?
It’s important to be proactive, but “trouble” is relative. There’s no hard and fast rules on exactly what your 95th percentile bandwidth metering, peak bandwidth, or average bandwidth should be. But, there are several indicators of network capacity issues that can help you proactively investigate and address problems.
If you see a sharp increase in packet discards, that is a good sign network interfaces are overloaded. Additionally, regular spikes to 100% peak bandwidth utilization are often red flags. Using the 95th percentile, values above ~70% are a good reason to investigate. Above that level, congestion and retransmissions can begin to create performance issues.
And let’s not forget the “unscientific” method that’s there’s an issue looming: increased complaints from end users! As annoying as it might seem, user issues can be your canary in a coal mine that something is broken, congested, or just acting strangely. If they start coming in clusters, you know something’s up.
Of course, because acceptable performance and “trouble” are unique to each network, I can’t overstate the importance of network monitoring. Having a baseline helps you understand if a spike is “normal” or a potential problem. Additionally, the right network troubleshooting tools can help you drill down and weed out bandwidth issues from other problems like broadcast storms, faulty hardware, or configuration issues.
Once you do get to the root cause, you can decide on how to remediate the issue. In some cases, that means bandwidth or hardware upgrades. In others, network optimization or correcting a configuration. But in any case, getting to the right conclusion requires capturing the right data.
How does the 95th percentile apply to future capacity planning?
Beyond helping you identify problems, the 95th percentile can help you understand how much room for growth you can accommodate given the state of the network “most of the time” (with less bias than peak outliers or unrealistic averages). For example, if your 95th percentile bandwidth metering is consistently around 20-30%, you won’t have much to worry about if the network will grow by 10%. However, if you’re already near 65-70%, it may be time to upgrade.
Similarly, tracking your 95th percentile performance can help you accurately estimate what amount of bandwidth a similar deployment will consume. If you already have the data for a 20-employee office, you know what to expect when standing up another one.
In many cases, capacity planning becomes a balancing act between budget and performance. Overprovisioning reduces (but doesn’t eliminate!) the risk of bottlenecks, but can be wasteful. On the other hand, not investing in more bandwidth capacity and upgraded network hardware when you need it can hamstring network performance and end-user productivity.
Network visibility and metrics like 95th percentile performance won’t be a magic bullet, but they will enable you to make informed decisions about network bandwidth and plan your network upgrades intelligently.
Tools like Auvik can give you real-time and historical performance metrics. Get your free 14-day Auvik trial here.

Excellent article. I recently had to try and explain the 95th percentile concept to a customer. We had Internet bandwidth set to 30mbs based on 3 months or monitoring. One day Internet usage increases sharply and we had to increase circuit size to 125mbs. There was no burst rate above 30mbs so packets were dropped. Very difficult to provision for this scenario. The users had all received an email which resulted in increased Internet access. Hence the massive performance issues. Your article will help me explain this issu.e.
.
Are there some network monitoring products that would provide calculated 95th percentile information?
What an absolutely brilliant article! Found this really useful